A historical look at Deer density in the United States – where are you most likely to harvest a deer?
From a hunter’s standpoint, the best population density for deer is whichever number guarantees they’ll always be able to go deer hunting – and have something to show for their trouble.
But to the whitetail, the best population density is quite different. The whitetail doesn’t want to compete against too many of its fellow deer for natural resources. Life’s no fun when you’re sharing the same patch of witchgrass with five other deer. On the other hand, a whitetail doesn’t want a snowball’s chance in Georgia of finding a mate (or several mates, ideally, because bucks are frisky critters).
So what is the best deer population density as far as sustainability is concerned? About 0.03 to 0.05 deer per acre (i.e. 20 to 30 acres per deer), give or take. Let us explain why that is.
What Is Population Density?
Population density is a numeric measurement of the number of individuals in a given space. For example, Manhattan covers 22.82 square miles and contains about 1.63 million people. That puts the borough’s population density at approximately 71,353 poor souls per square mile. (It does sound a little better when you say Manhattan has 113 people per acre.)
Deer Population Density in American History
There is no definitive record of deer population density throughout United States history. Somehow setting up a decennial deer census escaped our Founding Fathers’ minds. But thanks to the efforts of The Wildlife Society, we have a fairly good estimate of historic whitetail population density in the Southeastern United States dating back to 1940.
- 1940 – 0.22 deer/km2
- 1950 – 0.35 deer/km2
- 1970 – 2.2-3.1 deer/km2
- 1982 – 4.6 deer/km2
- 2003 – 8-9 deer/km2
Why Is Deer Density Increasing?
Remember, the above data only estimate whitetail population density in the Southeast United States – a warm and damp climate with plenty of plants for deer to eat. But those figures do paint a telling picture: The American whitetail population is increasing. This is largely due to the fact that Americans don’t want the whitetail’s natural predators anywhere around them, which creates an altogether safer habitat for deer to be fruitful and multiply in.
American deer populations are also steadily increasing because Americans are losing interest in hunting. There are now about 30 percent fewer deer hunters in Michigan than there were in 1995. Seventeen million Americans bought 28.3 million licenses in 1982, yet only 11.5 million of us went hunting in 2020.
What Is the Best Population Density for Deer?
Whitetail were once relatively rare in the United States. It is estimated that the entire country contained a mere 300,000 individuals in 1890. That’s 0.0001 whitetail per acre, which we can assume is close to the natural countrywide population density.
(We’re quite aware that the concept of “countrywide population density” is ridiculous in a country with so many distinctive biomes. The lush land of New Hampshire can obviously support a higher population density of deer than Death Valley.)
Whitetail may have had to contend with more wolves, mountain lions, bears and coyote back in 1890, but at that low a population density they didn’t face their greatest threat: food shortages. The browse plants which comprise about 50 to 80 percent of a whitetail’s diet could easily replenish themselves when there was only one deer for every 10,000 acres of countryside.
Generally speaking, 0.03 to 0.05 deer per acre is considered a safe and sustainable population density. That number can go up or down depending on the land. If you’re talking about a nicely forested area (especially one with an owner who was thoughtful enough to plant a food plot), it may easily sustain 0.08 to 0.10 deer per acre. If it’s rugged terrain with no fruits, vegetables or acorns in sight, then the sustainable population density may sink below 0.001 per acre.
How Do You Tell If Deer Population Is too High?
Interestingly, whitetail show few to zero physical signs that they’re starving until they actually die. First the fat over the rump and saddle disappears, causing the skin to sag. A starving whitetail may also become fuzzier around the face, similar to the way people suffering from eating disorders can get lanugo. The only way to prove a whitetail died of starvation is to saw one of its bones in half. If the marrow is blood red, that demonstrates the animal exhausted all of its available fat reserves.
When an area is overpopulated by deer, its vegetation is also going to tell the story. If you notice that a deer’s favorite foods are all gone – and even their less preferred alternatives are becoming sparse – that’s a clear sign of overpopulation.
If you’d like better confirmation that there are too many deer on your land, build an exclusion cage. Pick a spot where a preferred whitetail food source is growing and cordon off a 3’x3’ area with chicken wire. If the protected plants flourish while surrounding ones vanish, there’s probably more munching going on than the land can reliably sustain.
Pay attention to your own instincts too. If you know your area well, then you can tell when there are more deer around than usual. Increased sightings and trail cam photos both indicate the population is reaching untenable density.
Modern Day Deer Density

One way to explore the concept of deer density is to look at the number of bucks per square mile of geography harvested in North America. The National Deer Association tracks a number different stats that are useful to hunters looking to learn more.
Antlered Buck Harvest By State
| 2018 | 2019 | 2020 | 2020 Bucks per Sq. Mile | Buck Harvest per 100 Hunters | |
|---|---|---|---|---|---|
| Alabama | 73,000 | 88,896 | 116,514 | 2.3 | 51 |
| Arkansas | 97,607 | 89,411 | 103,973 | 2 | 32 |
| Florida | 48,250 | 48,724 | 43,643 | 0.8 | 41 |
| Georgia | 129,284 | 129,329 | 114,759 | 2 | 55 |
| Louisiana | 83,408 | 88,920 | 99,736 | 2.3 | 58 |
| Mississippi | 90,697 | 100,032 | 122,013 | 2.6 | 74 |
| North Carolina | 73,925 | 82,724 | 86,335 | 1.8 | 36 |
| Oklahoma | 69,851 | 64,364 | 72,874 | 1.1 | 16 |
| South Carolina | 109,208 | 95,974 | 97,690 | 3.2 | 65 |
| Tennessee | 74,592 | 71,866 | 86,397 | 2.1 | 51 |
| Texas | 508,155 | 460,242 | 449,933 | 1.7 | 58 |
| Southeast Total/Avg | 1,357,977 | 1,320,482 | 1,393,867 | 1.8 | 47 |
| Connecticut | 5,911 | 5,814 | 5,824 | 1.2 | 23 |
| Delaware | 4,505 | 4,861 | 7,640 | 3.9 | 48 |
| Maine | 18,241 | 20,036 | 19,139 | 0.6 | 9 |
| Maryland | 29,699 | 29,233 | 29,242 | 3 | 51 |
| Massachusetts | 8,199 | 7,764 | 8,506 | 1.1 | 17 |
| New Hampshire | 8,029 | 7,870 | 7,986 | 0.9 | 14 |
| New Jersey | 21,545 | 18,852 | 21,675 | 2.9 | 23 |
| New York | 113,385 | 120,403 | 116,433 | 2.5 | 20 |
| Pennsylvania | 147,750 | 163,240 | 174,780 | 3.9 | 26 |
| Rhode Island | 994 | 1,072 | 1,148 | 1.1 | 23 |
| Vermont | 10,028 | 10,058 | 9,256 | 1 | 11 |
| Virginia | 96,442 | 100,095 | 101,509 | 2.6 | 51 |
| West Virginia | 61,392 | 56,189 | 59,637 | 2.5 | 30 |
| Northeast Total/Avg | 526,120 | 545,487 | 562,775 | 2.4 | 25 |
| Illinois | 69,777 | 71,186 | 75,415 | 1.4 | 32 |
| Indiana | 47,256 | 51,646 | 55,446 | 1.5 | 26 |
| Iowa | 46,198 | 44,093 | 49,662 | 0.9 | 29 |
| Kansas | 41,056 | 40,718 | 44,379 | 0.5 | 40 |
| Kentucky | 70,952 | 70,362 | 69,443 | 1.8 | 20 |
| Michigan | 211,754 | 211,228 | 219,387 | 3.9 | 39 |
| Minnesota | 94,594 | 97,960 | 100,558 | 1.3 | 21 |
| Missouri | 136,851 | 134,092 | 140,855 | 2 | 30 |
| Nebraska | 27,194 | 29,899 | 29,726 | 0.4 | 31 |
| North Dakota | 22,657 | 24,000 | 25,400 | 0.4 | 24 |
| Ohio | 71,369 | 80,138 | 80,001 | 2 | 40 |
| South Dakota | 27,211 | 26,404 | 36,394 | 0.5 | 52 |
| Wisconsin | 160,075 | 138,297 | 158,236 | 2.9 | 25 |
| Midwest Total/Avg | 1,026,944 | 1,020,022 | 1,084,902 | 1.4 | 29 |
| 3-Region Total/Avg | 2,911,041 | 2,885,991 | 3,041,544 | 1.7 | 34 |
| Arizona | 9,522 | 9,365 | 9,057 | 0.1 | 15 |
| California | - | - | - | - | - |
| Colorado | 30,114 | 28,310 | 30,411 | 0.3 | 35 |
| Idaho | 15,162 | 13,965 | 35,366 | 0.4 | 24 |
| Montana | 26,323 | 26,739 | 29,120 | 0.2 | * |
| Nevada | - | - | - | - | - |
| New Mexico | 10,568 | 10,544 | 11,151 | 0.1 | 29 |
| Oregon | 31,525 | 30,318 | 36,615 | 0.4 | 27 |
| Utah | - | - | - | - | - |
| Washington | 23,955 | 6,522 | 25,408 | 0.4 | 24 |
| Wyoming | 9,405 | 29,176 | 27,938 | 0.3 | 44 |
| West Total/Avg | 156,574 | 194,206 | 205,066 | 0.3 | 31 |
| Alberta | 24,198 | * | * | * | * |
| British Columbia | * | * | * | * | * |
| Manitoba | * | * | * | * | * |
| New Brunswick | 5,094 | 6,025 | 6,182 | 0.2 | 16 |
| Nova Scotia | 7,204 | * | * | * | * |
| Ontario | 33,630 | 31,629 | 31,748 | 0.1 | 17 |
| Quebec | 29,654 | 26,091 | 29,716 | 0.1 | 22 |
| Saskatchewan | 24,468 | * | 21,862 | 0.1 | 52 |
| Canada Total/Avg | 124,248 | 63,745 | 89,508 | 0 | 22 |
What can we learn from the data in the table above? Well, there are a few takeaways that most hunters will at least find interesting, if not 100% actionable.
What State Am I Mostly Likely to Bag A Buck?
Mississippi gave hunters the best chance to get a buck in 2020. For every 100 licensed hunters in the state, 74 of them tagged a buck. South Carolina, Louisiana, and Texas rounded out the top 4.
Density by State
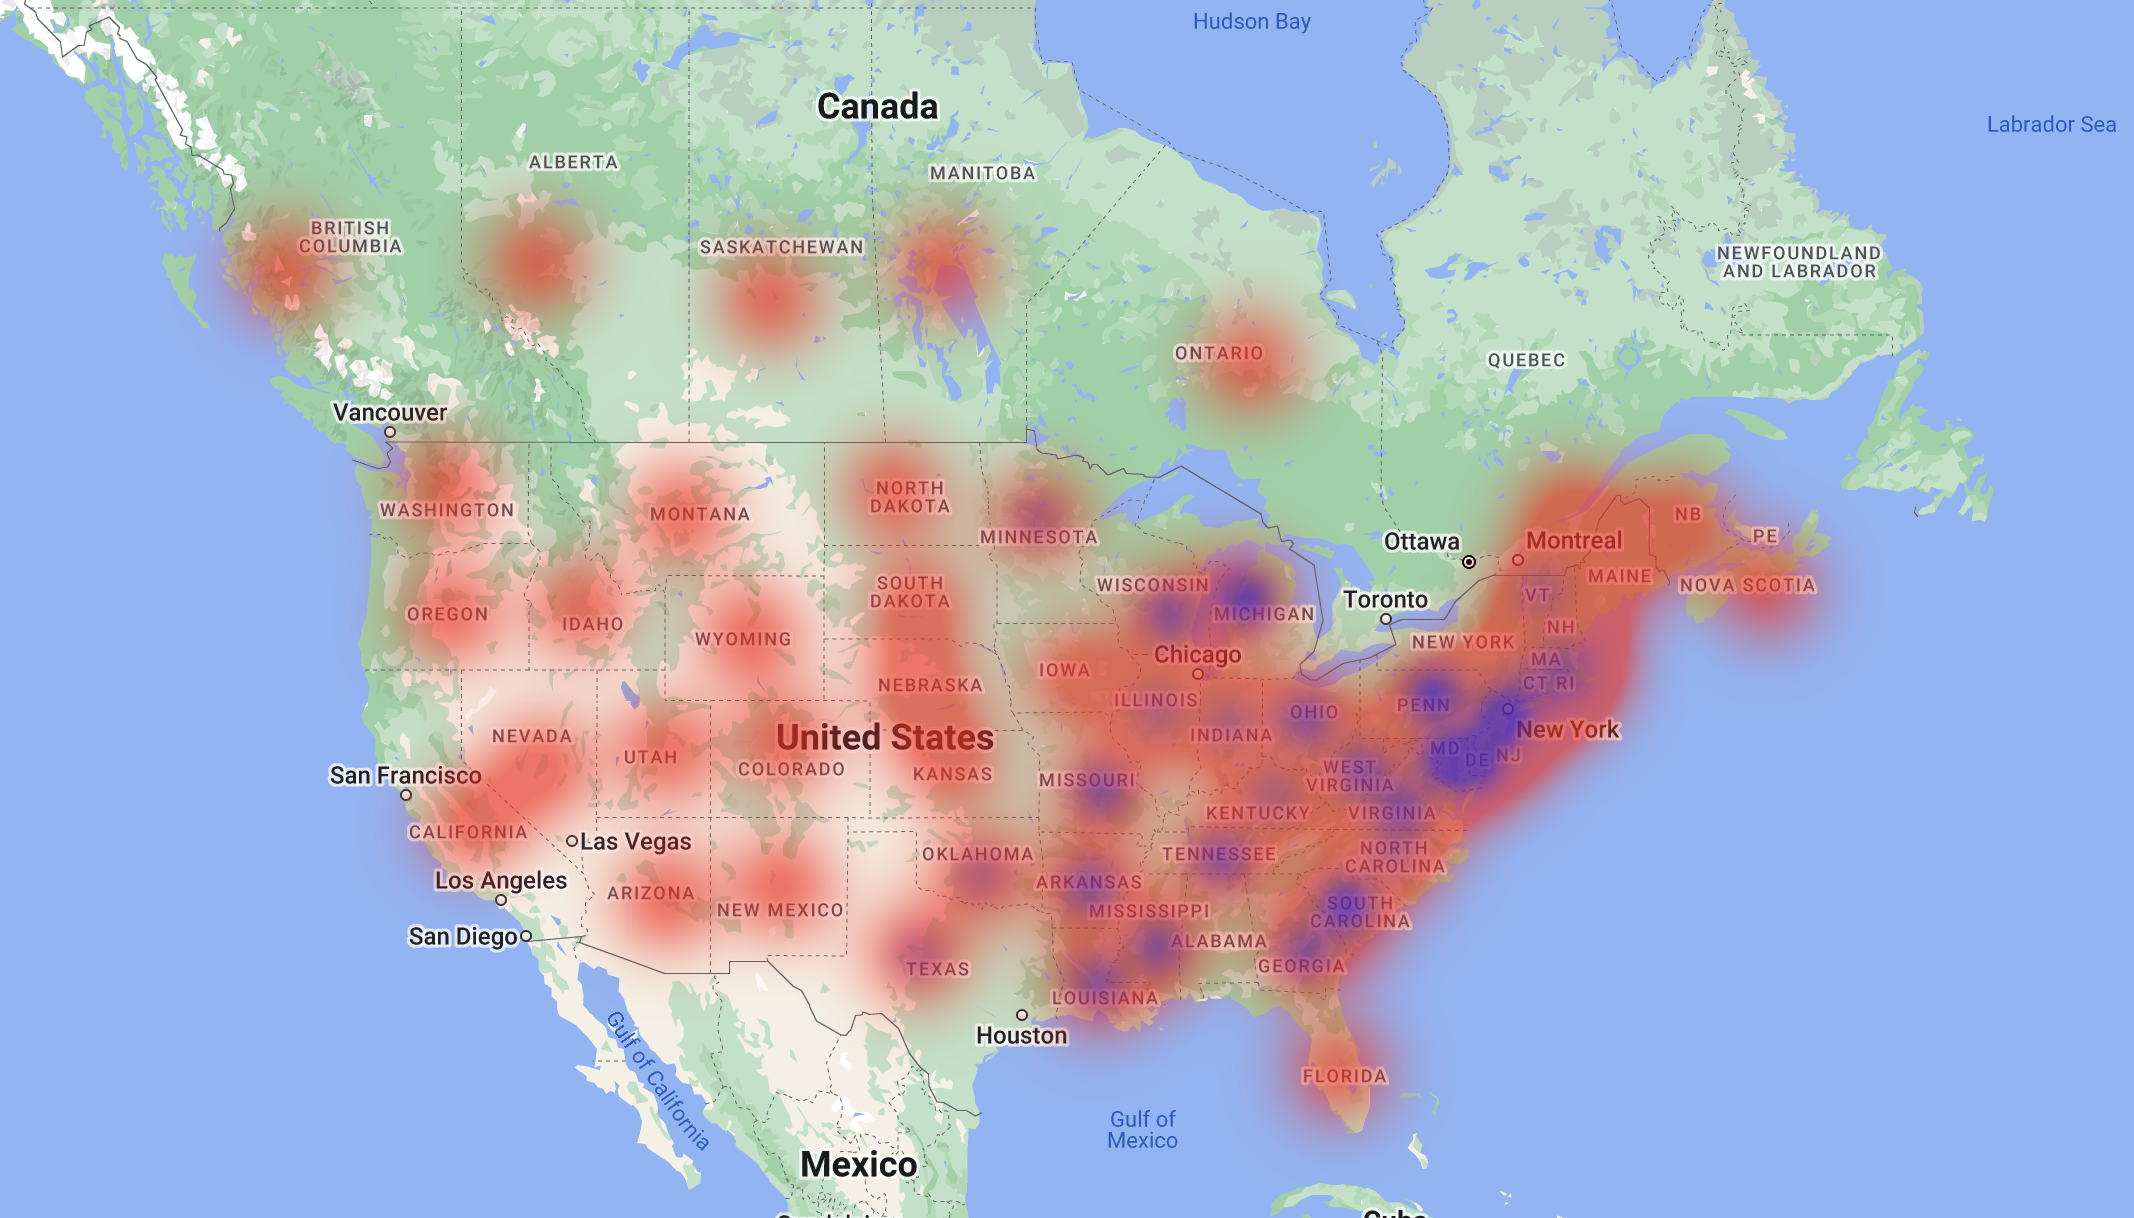
When it comes to deer density per square mile, we can look at harvested buck data to give us some answers. In 2020, the data compiled by the National Deer Association suggests Delaware has the most harvested deer per square mile with 3.9 bucks taken per square mile of area. Here’s a look at the top 20 states.
Antlered Bucks Harvested Per Square Mile
| Delaware | 3.9 | New York | 2.5 |
| Michigan | 3.9 | Louisiana | 2.3 |
| Pennsylvania | 3.9 | Alabama | 2.3 |
| South Carolina | 3.2 | Tennessee | 2.1 |
| Maryland | 3 | Georgia | 2 |
| Wisconsin | 2.9 | Ohio | 2 |
| New Jersey | 2.9 | Arkansas | 2 |
| Mississippi | 2.6 | Missouri | 2 |
| Virginia | 2.6 | North Carolina | 1.8 |
| West Virginia | 2.5 | Kentucky | 1.8 |
Where is the lowest antlered buck density? Look to the southwest. California, New Mexico, Arizona, Nevada and Utah near the bottom and in the case of several of those states, whitetail deer records aren’t even tracked.
How Can I Help Reduce Deer Population Density?
That’s easy! Here are just a few ways you can do your part:


